S-23 — Statistical Validation Report
Statistical analysis of the complete backtest.
✓ Core performance figures on this page were verified directly from the raw trade log.
HYPOTHETICAL PERFORMANCE RESULTS HAVE MANY INHERENT LIMITATIONS, SOME OF WHICH ARE DESCRIBED BELOW. NO REPRESENTATION IS BEING MADE THAT ANY ACCOUNT WILL OR IS LIKELY TO ACHIEVE PROFITS OR LOSSES SIMILAR TO THOSE SHOWN; IN FACT, THERE ARE FREQUENTLY SHARP DIFFERENCES BETWEEN HYPOTHETICAL PERFORMANCE RESULTS AND THE ACTUAL RESULTS SUBSEQUENTLY ACHIEVED BY ANY PARTICULAR TRADING PROGRAM. ONE OF THE LIMITATIONS OF HYPOTHETICAL PERFORMANCE RESULTS IS THAT THEY ARE GENERALLY PREPARED WITH THE BENEFIT OF HINDSIGHT. IN ADDITION, HYPOTHETICAL TRADING DOES NOT INVOLVE FINANCIAL RISK, AND NO HYPOTHETICAL TRADING RECORD CAN COMPLETELY ACCOUNT FOR THE IMPACT OF FINANCIAL RISK IN ACTUAL TRADING. FOR EXAMPLE, THE ABILITY TO WITHSTAND LOSSES OR TO ADHERE TO A PARTICULAR TRADING PROGRAM IN SPITE OF TRADING LOSSES ARE MATERIAL POINTS WHICH CAN ALSO ADVERSELY AFFECT ACTUAL TRADING RESULTS. THERE ARE NUMEROUS OTHER FACTORS RELATED TO THE MARKETS IN GENERAL OR TO THE IMPLEMENTATION OF ANY SPECIFIC TRADING PROGRAM WHICH CANNOT BE FULLY ACCOUNTED FOR IN THE PREPARATION OF HYPOTHETICAL PERFORMANCE RESULTS AND ALL OF WHICH CAN ADVERSELY AFFECT ACTUAL TRADING RESULTS.
Hypothetical/backtested results — not indicative of future results. See the full Hypothetical Performance Disclosure.
Robustness profile
The statistical analysis evaluated the system against nine robustness criteria. The backtest met all nine:
- Statistically significant edge (p < 0.001)
- Equity-curve linearity (R² = 0.985)
- System quality (SQN = 6.85)
- Stable performance across both halves of the backtest
- 100% of 24-month windows closed above breakeven
- Sample size of 3,050 trades over 6.4 years
- Edge robust to fill noise (positive in 100% of runs at ±2 ticks)
- Sequence-independent edge (100% of 5,000 Monte Carlo paths ended above breakeven)
- Low risk of ruin (3.1%)

Caption: Cumulative net result across all 3,050 trades, with least-squares linear fit (R² = 0.985).
Performance metrics
NET RESULT
$41,342
Across 3,050 trades, after commission
TOTAL TRADES
3,050
1,752 long · 1,298 short
WIN RATE
48.8%
1,487 W · 1,563 L
PROFIT FACTOR
1.31
Gross gains / gross losses
EXPECTANCY
$13.55
Per-trade average, net
AVG WIN / AVG LOSS
$117.00 / −$84.86
Win/Loss ratio 1.38
MAX DRAWDOWN
$3,338
Over 220 trades (Apr 2021)
MAX LOSING STREAK
24
Average streak 4.1
SQN
6.85
System Quality Number
K-RATIO
8.09
Equity-curve smoothness
MAR RATIO
1.95
Return vs. max drawdown
EQUITY R²
0.985
Linearity of the equity curve
ULCER INDEX
21.63
Moderate — drawdowns can be prolonged
YEARS ABOVE BREAKEVEN
6 of 6
No losing calendar year

Caption: Drawdown from running equity peak. Maximum historical drawdown: $3,338 (April 2021), recovered over the following months.
Statistical edge
Expectancy test. Average net result per trade of $13.55 (standard deviation $109.30) yields a t-statistic of 6.849 and a p-value below 0.001 — a highly significant result. The probability this edge is due to chance is under 1 in 1,000.
Win-rate test — stated plainly. The win rate of 48.8% is not statistically above 50% (z = −1.376, p = 0.916). The edge does not come from how often it wins; it comes from average wins ($117.00) being larger than average losses ($84.86). A win rate below 50% can still produce a positive expectancy when winners outsize losers.
95% confidence intervals
| Measure | 95% confidence interval | Read |
|---|---|---|
| Expectancy | $9.65 → $17.80 | Entire range positive |
| Profit Factor | 1.22 → 1.42 | Entire range above 1.0 |
| Win Rate | 47.0% → 50.5% | Spans 50% |
| Max Drawdown | $1,377 → $3,419 | Bounded |
Sample-size confidence: with 3,050 trades, the 90%, 95% and 99% confidence thresholds are all achieved.
Consistency over time
First half vs. second half
| Metric | First half (1,525) | Second half (1,525) | Change |
|---|---|---|---|
| Win Rate | 49.9% | 47.6% | −4.6% |
| Profit Factor | 1.30 | 1.32 | +1.4% |
| Expectancy | $12.80 | $14.31 | +11.8% |
| Avg Win | $110.43 | $123.89 | +12.2% |
| Avg Loss | $84.45 | $85.27 | +1.0% |
| Equity R² | 0.928 | 0.982 | +5.8% |
| Max Drawdown | $3,338 | $2,352 | −29.5% |
| Total P&L | $19,522 | $21,821 | — |
The second half held or improved on the first across nearly every measure — no sign of edge decay.
Year by year
| Year | Trades | Win Rate | Profit Factor | Expectancy | Equity R² | Net Result |
|---|---|---|---|---|---|---|
| 2020 | 494 | 51.2% | 1.33 | $13.09 | 0.920 | $6,466 |
| 2021 | 488 | 52.5% | 1.40 | $15.81 | 0.768 | $7,715 |
| 2022 | 480 | 46.3% | 1.18 | $8.48 | 0.653 | $4,069 |
| 2023 | 478 | 49.8% | 1.32 | $13.23 | 0.908 | $6,322 |
| 2024 | 476 | 48.5% | 1.37 | $15.79 | 0.930 | $7,518 |
| 2025 | 454 | 45.6% | 1.30 | $14.34 | 0.722 | $6,508 |
| 2026 (partial) | 180 | 44.4% | 1.30 | $15.24 | 0.110 | $2,743 |

Caption: Net result by calendar year. Every full year closed above breakeven; 2026 is a partial year.
Result by quarter (full period)
Q1 $8,142 (19.7%) · Q2 $11,472 (27.7%) · Q3 $11,455 (27.7%) · Q4 $10,273 (24.8%) — contribution spread across all four quarters.
Rolling-window analysis
| Window | Windows | % Positive | Avg P&L | Worst window |
|---|---|---|---|---|
| 1 month | 77 | 75.3% | $537 | −$1,734 |
| 3 months | 75 | 86.7% | $1,616 | −$1,609 |
| 6 months | 72 | 93.1% | $3,224 | −$2,290 |
| 12 months | 66 | 100% | $6,262 | +$1,254 |
| 18 months | 60 | 100% | $9,775 | +$6,502 |
| 24 months | 54 | 100% | $13,135 | +$8,436 |
As the holding window lengthens, the share of positive windows rises to 100% at 12 months and beyond — the pattern expected of a genuine edge rather than noise.
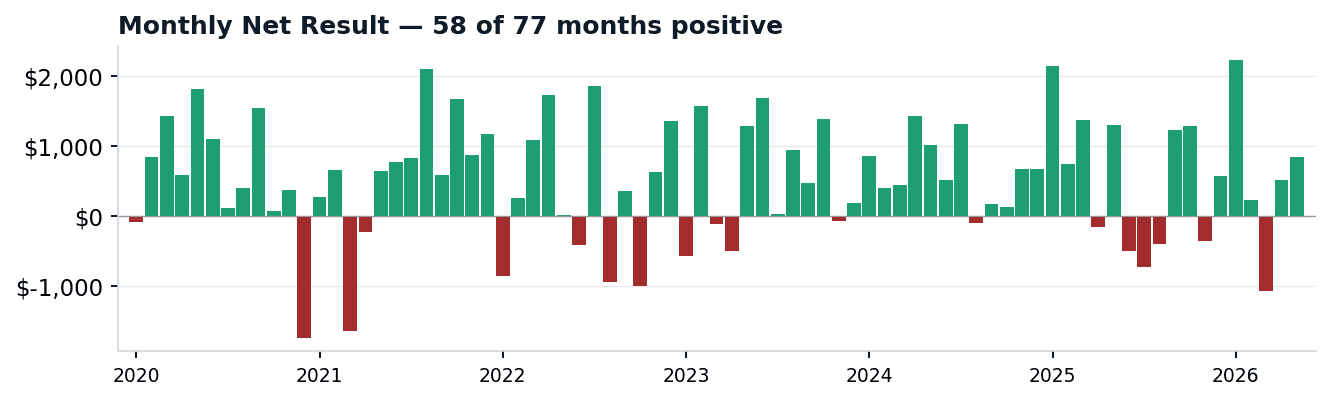
Caption: Monthly net result. 58 of 77 months closed positive across the test period.
Monte Carlo — sequence robustness
The trade sequence was randomized across 5,000 simulations to test whether the result depends on the specific order of trades. 100% of the 5,000 paths ended above breakeven, with a median ending equity of $37,227 and a median drawdown of $1,942.
| Percentile | Final equity | Max drawdown |
|---|---|---|
| Worst case | $30,590 | $4,894 |
| 5th | $34,140 | $2,934 (95th) |
| 25th | $35,970 | $1,693 |
| Median | $37,227 | $1,942 |
| 75th | $38,473 | $1,693 (25th) |
| Best case | $43,600 | $1,112 |
Risk of ruin
Across 10,000 randomized sequences, the probability of hitting a $2,000 drawdown threshold was 3.1% — classified Low. Median trades to a successful outcome: 160.
Slippage / noise robustness
Symmetric (mean-zero) price noise of up to ±5 ticks was applied to every fill across 1,000 simulations. Median result of $41,354 closely tracked the original $41,342 (drift 0.0%), with a positive-result share of 100% at every noise level tested and a 5th–95th percentile band of $41,183 → $41,513. The edge reflects structure, not lucky fills.
Trade activity
77 months of operation · 39.6 trades per month on average · 0 months without trades · peak month March 2021 (56 trades).
PERFORMANCE BY DIRECTION
Long and short, reported separately
S-23 trades the long side and the short side as two independent configurations, each with its own parameter set. For that reason, a backtest of a single configuration will not match the combined figures shown above — it corresponds to one direction at a time. The breakdown below reports each direction separately, at the same level at which the backtest can be re-run and verified: the Long preset corresponds to the long-side results, and the Short preset to the short-side results. The combined column is the sum of both configurations operating side by side.

Comparative metrics by direction. All figures net of $1.30 round-trip commission, from the raw trade logs.

Cumulative net result, long configuration only — 1,752 trades, linear fit R² = 0.976.

Cumulative net result, short configuration only — 1,298 trades, linear fit R² = 0.972.
Risk disclosure. S-23 is a software tool. It does not constitute financial advice, an investment recommendation, or personalized advisory services. Seraphim Quant LLC is not a registered investment adviser, commodity trading advisor, or broker/dealer. The figures on this page are derived from a historical backtest and are hypothetical; hypothetical results have inherent limitations and do not reflect live execution. Trading futures involves substantial risk of loss and is not suitable for all investors. Past performance does not guarantee future results. See our complete Risk Disclosure Statement before making any purchase or operational decision.
Seraphim Quant LLC · Figures produced through standard statistical analysis; core performance metrics verified from the raw trade log · © 2026 Seraphim Quant LLC